Dynamic Data Validation in Excel
Dynamic Data Validation
The data validation tool in Excel is a wonderful feature that can help you quickly select an item from a list. However, if the list is growing over time, then you will want the data validation to be dynamic and expand to accommodate the growing list. One way to do this very efficiently in Excel is to use the Table Tool.
The Situation
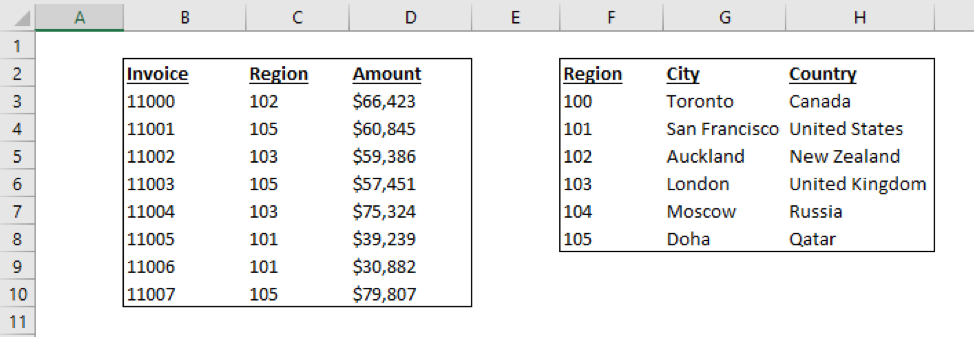
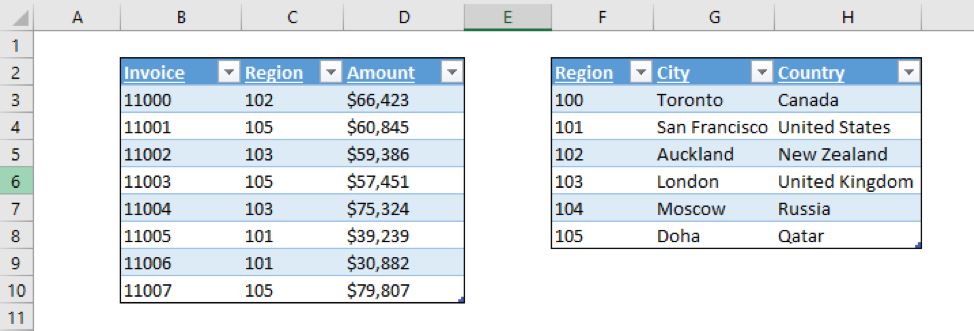
In the table below on the left, we have a data table with invoice numbers for sales into various regions (download the file here). Information about each region can be found in the lookup table on the right which shows the city and country. As the business grows, more invoices and more regions will be added.
Creating the Tables
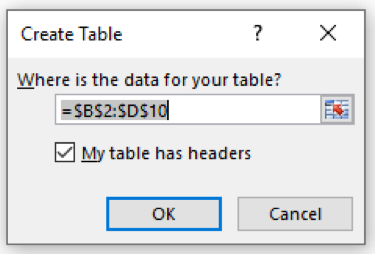
One of the simplest and most powerful automation tools in Excel is the Table feature. We will use it here in order to automate the contents of our dropdown list. First, we need to create Tables using Excel’s Table feature. To start, select the data table on the left including the headers and click Insert – Table (CTRL T). The dialogue box below should appear indicating the Table has headers. Click OK.
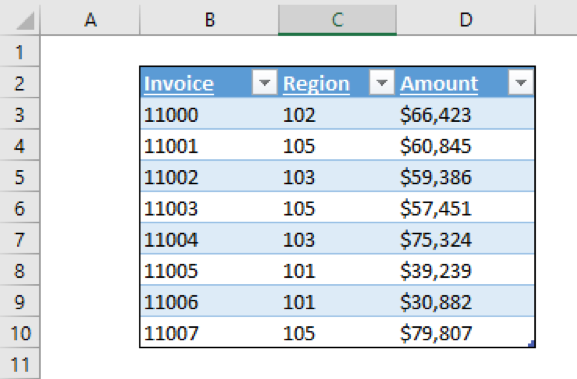
Your table should now look like the one below.
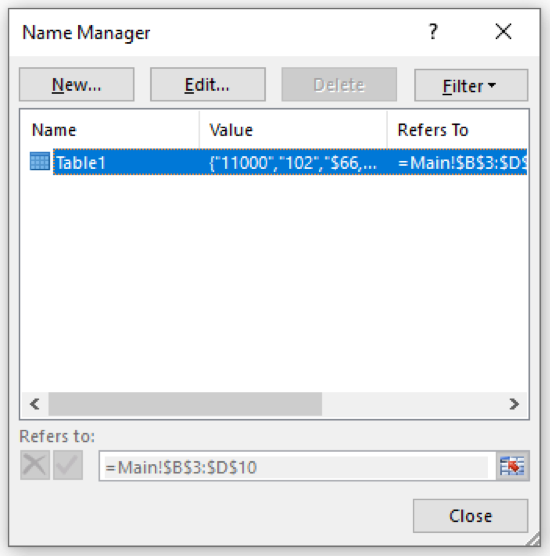
You could now go into the Formulas – Name Manager (ALT MN or CTRL F3) to see the name of the Table shown below as Table1. By clicking Edit, you could rename this Table as InvoiceData.
A similar procedure could be followed for the lookup table on the right which could be named RegionLookup. This will result in the two tables shown below.
Adding Dynamic Data Validation
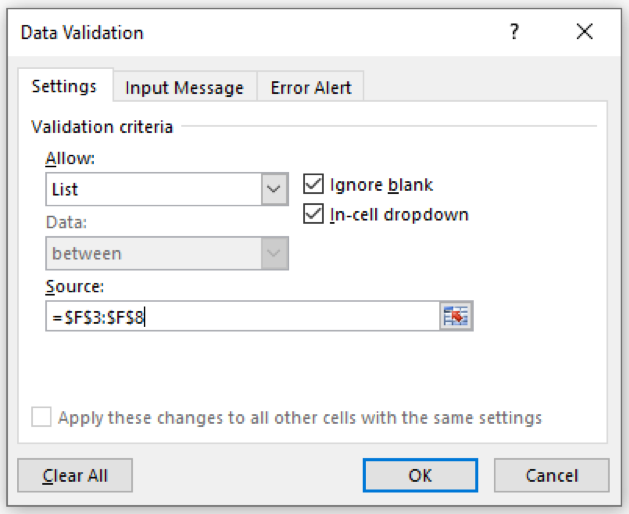
Next, we would like to add data validation to the region field in the InvoiceData table. The trick here is to make sure we add data validation to every region listed in the InvoiceData table. In the InvoiceData table, select from the first region (cell C3) down to the last one (cell C10). Now click Data – Data Validation (ALT A V V) which will generate the dialogue box below.
In the Settings tab, select List and then select the Source. For the Source, select all of the regions from the RegionLookup table (cells F3 – F8). As shown below, the Source looks static since it appears as though it will only include the items from cells F3 to F8. Click OK.
Note: the data validation could also be set up by using structured reference function format as =RegionLookup[Region]. However, this reference would need to be pasted into a defined name which the data validation could refer to. This technique is more complicated than the approach we are suggesting here.
Testing the Solution
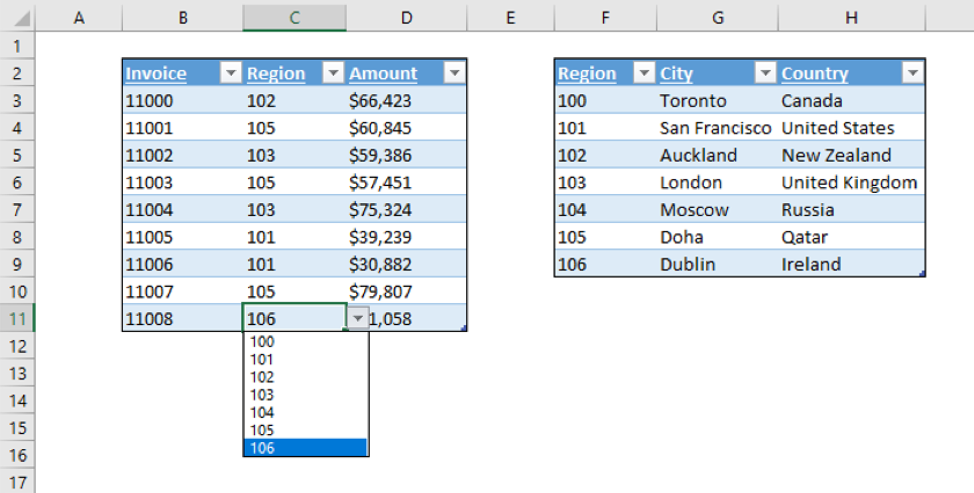
Now it is time to test your data validation. Enter a new record in the RegionLookup table. First, add a new region (106) to cell F9 in the RegionLookup table. Once you hit ENTER, you will see the RegionLookup Table expand to include this region. Now add Dublin in cell G9 and Ireland in cell H9.
Next, we will enter new records to the InvoiceData table. Add the next invoice number of 11008 into cell B11. The table will expand downwards. Now, when you move into the region (cell C11) for this invoice, the cell will already have data validation. Opening the data validation (ALT DOWN ARROW) will show that the selection has expanded to include region 106 as shown below. The invoice amount of $31,058 can now be entered into cell D11. The tables shown now look like the ones shown below.
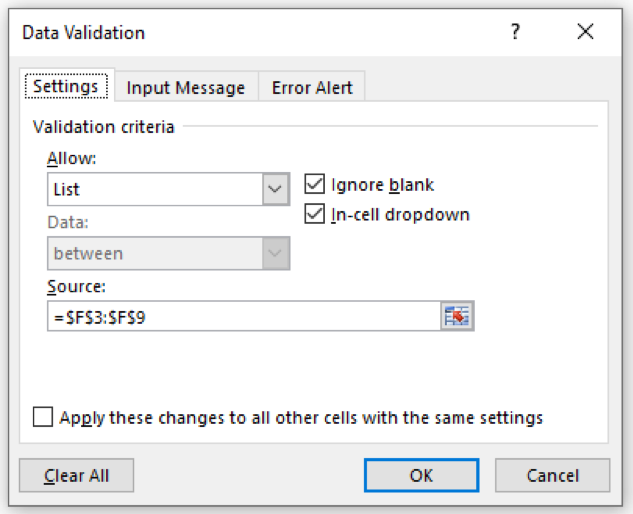
Checking the data validation settings in cell C11 should show the dialog box below. Even though the Source looks static, it is behaving in a dynamic way since it is referencing a Table. As shown below, the Source has expanded down to include cell F9.
Summary
This is a great way to use Tables to ensure that data validated cells will dynamically pick up new items when they are added to a list. Even though the source for data validation may look static, it will behave in a dynamic way since it is referencing a Table. As we add new regions to the RegionLookup table, they will automatically appear in our data validation in the Region column of the InvoiceData table.
As a next step, you may be inclined to use a lookup function in the InvoiceData table to add a column for City and Country. This would allow you to have one table with all the information together. However, one of the things we discuss in our Power BI course is that this is not efficient since it leads to repetition of the City and Country information every time an invoice is loaded in for a certain region. Instead, we keep these two tables separate and form a data model by connecting them using the relationship between their common Region keys. Avoiding repetition by creating a data model is one of the principal reasons why Power BI can analyze large data sets very quickly.