Advanced Scenario Analysis using Multidimensional Data Tables in Excel
In the November 2017 edition of the Quagmire Challenge, we introduced a problem where we asked participants to sensitize an analysis for three key drivers. Our solution proposed using two data tables.
However, it is possible to do this using a single multidimensional data table. This technique can be used for any analysis where more than two variables need to be sensitized. This could include:
- Potential acquisition structuring or purchase prices
- Potential financing scenarios (debt amount and terms)
- Complex operating assumptions
It is important to note that this analysis is best suited to sensitizing point-in-time assumptions and should not be used in place of a dynamic scenarios tab (as discussed in our modeling courses).
Assuming the analysis has otherwise been completed without the sensitivity analysis, three steps are required to build a multidimensional data table:
- Set up the Data Input
- Integrate Data Input into Analysis
- Construct Data Table
Set up the Data Input

In this section, we will be able to create multiple scenarios with different assumptions for the key drivers.
- Identify the key drivers in the analysis. Each driver will be one row in the table.
- Populate the scenario numbers across the top of the table. Be sure to leave an empty column between your key driver labels and the first scenario. This space will house the “Live” scenario.
- Under the Live scenario number, enter “2” (or your preferred scenario number). This is called the “Scenario Switch”.
- Populate the Live scenario using lookup functions (INDEX / MATCH, OFFSET, HLOOKUP, etc.) and the Scenario Switch.
Integrate Data Input into Analysis
Once the data input section has been built, it must be integrated into the analysis. This is done by linking each row in the “Live” column to its corresponding input in the analysis.
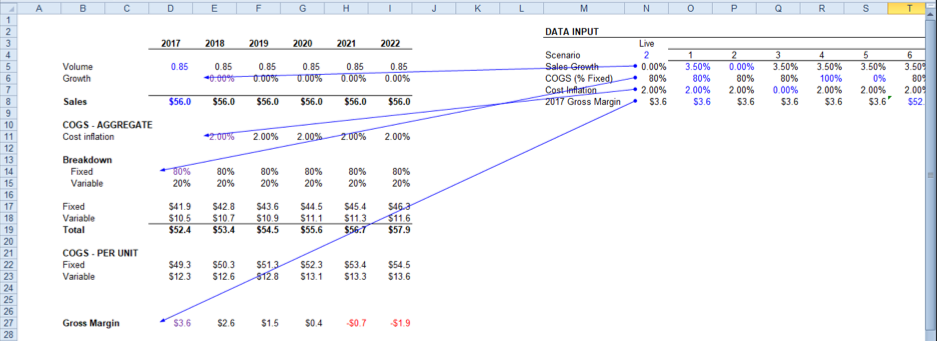
Doing this will allow the scenario changes to roll through the rest of the analysis. We can then use a data table to sensitize the analysis.
Construct Data Table
The data table should be structured with the items to be sensitized in rows and the scenario numbers as column headings.
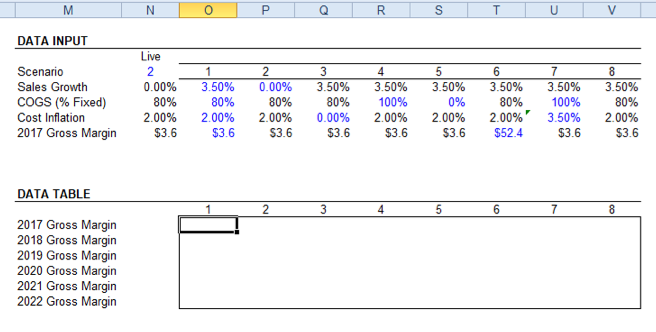
We need to provide the data table with items to sensitize. We do this by linking back to the original analysis.
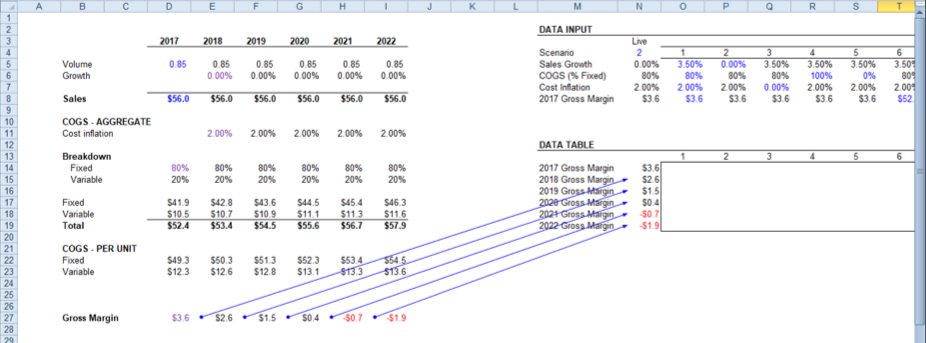
After establishing the structure of the data table, it can be activated.
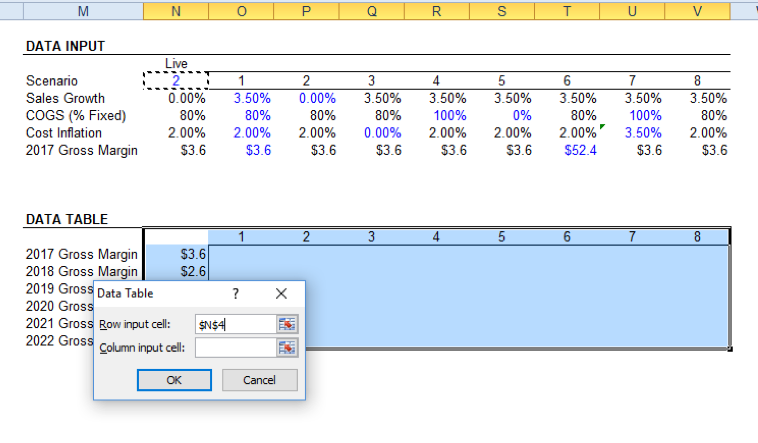
First, select the table – the top row must be the scenario numbers and the left-most column must be the links to the analysis. Then, in the ribbon, select Data Table (this can be accessed via Data -> Data Tools -> What-If Analysis -> Data Table). Preferably, you would use the shortcut Alt + A + W + T or Alt + D + T in Excel 2003.
In the resulting dialog box, select the Scenario Switch as the “Row input cell” and leave the “Column input cell” field blank. Select “OK”.
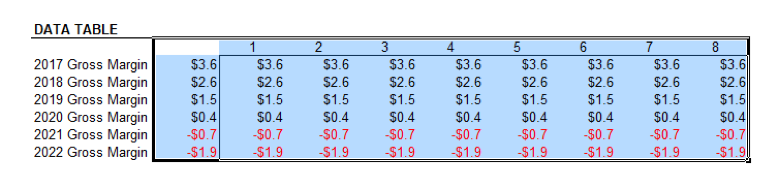
The previously blank table will now be populated with values. However, you may notice that the values are consistent across each column. In order to complete the analysis, you must press F9 to recalculate.
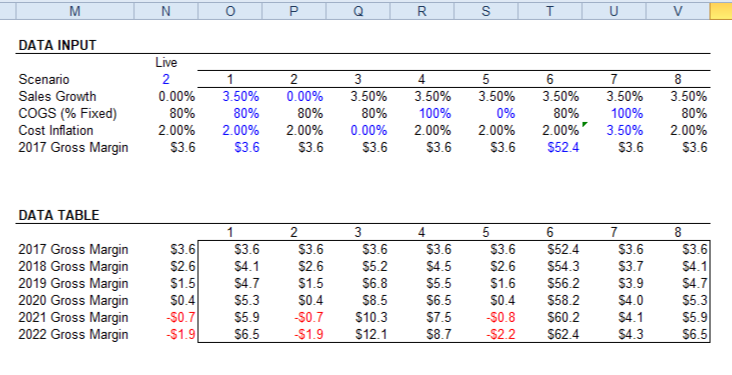
Given the “wall of numbers” quality of these tables, particularly as they grow in size, it is important to use formatting to make it easier to understand. It is not uncommon to see multidimensional data tables with over 20 scenarios and 100 sensitized items.