Building a Financial Model (for FP&A)
Congratulations, you’ve just completed Building a Financial Model (of a Company) and learned how to build a dynamic, integrated 3 statement financial model. But you’re an FP&A Revenue Analyst whose job it is to forecast sales and explain the variances. Or a Cost Accountant whose job it is to analyse plant operations and activity-based costing. You haven’t seen a Cash Flow Statement since Accounting 101 in university.
There are many Finance roles whose responsibilities are much narrower in scope than a traditional financial model encompasses. A Revenue Analyst or Cost Accountant can be as dependent on good financial models as an investment banker, but their focus is generating a forecast in a way that will allow them to tell the story of a) What happened, b) Why it happened, and c) What it means. How do you take what you’ve just learned and build a financial model that meets the needs of a specialty financial forecast, a model designed to focus on a very particular financial function, such as revenue or cost of manufacture, but without a full financial statement view?
Fundamentals
There are many fundamental attributes of financial models, regardless of the type of model being built. These include:
- Clearly defined inputs and assumptions
- Intuitive and informative outputs and summaries
- Integrated, dynamic flow
- Simplicity in formulas
- Flexibility to adapt the model as needed
- Transparency of structure
Other aspects that should be considered in any model include scenario planning for sensitivity analysis and the need to effectively and appropriately incorporate history.
Build with a Purpose
As with any good financial model build, the first step in designing the architecture of a specialty model is doing a proper needs assessment. What is the objective of the model? What is being forecast or analysed? How will the information be used? How will the results be measured?
Often, the end point – how results are measured – is the best place to start.
Consider this – at the end of each reporting cycle it is the revenue analyst’s job to understand and explain why sales exceeded or missed forecast; a) What happened, b) Why it happened, and c) What it means. Therefore, when designing a model to forecast revenue and then be able to explain variances, it is necessary to build in the factors that not only have the most influence on the outcome, but that will be most prominent in the explanations.
Case Example
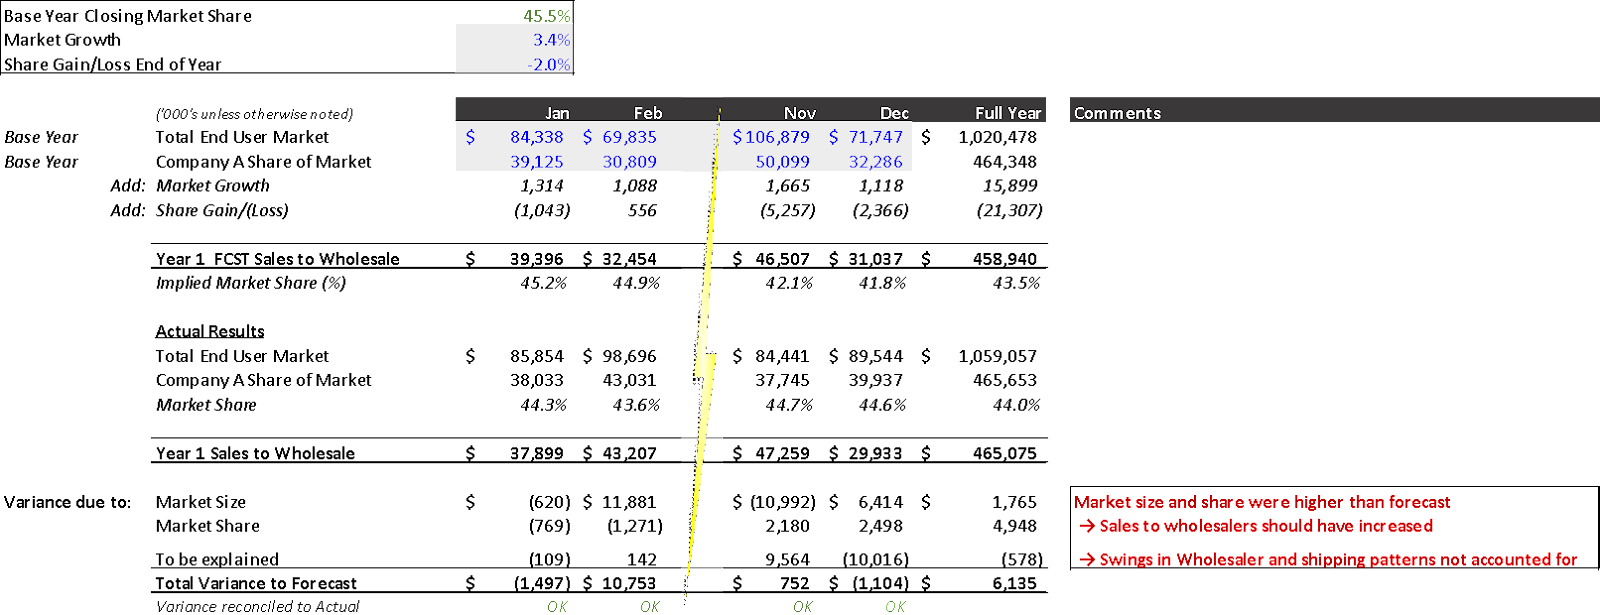
Company A has stable pricing for the products within its portfolio. Product distribution is exclusively through wholesale channels rather than direct ship to retail and efficiency has been managed with a consistent weekly delivery schedule. Financial Sales reporting is measured by sales to wholesalers, but overall company performance is projected and measured on end-user market size and market share.
What are the key factors to consider in generating a sales forecast for Company A?
In any given reporting period, sales performance for Company A is influenced not only by market trends, but by the regional impact for shipping days within that period and the level of inventory the various wholesalers are carrying relative to the market demand (DOH) – which can fluctuate depending on the time of year.
A traditional revenue forecast might take historical sales and apply pricing and growth factors, and perhaps seasonality, to generate a new forecast. But at the end of each reporting cycle, it becomes difficult for the analyst to provide meaningful and actionable variance explanations when the inputs do not necessarily reflect the true nature of the business. For example, the shipping days from the same period last year might be significantly different this year if a heavy shipping day is replaced with a light shipping day in a particular month, and so a simple growth factor might not work.
Let’s consider how to make the forecast, and hence variance explanations more meaningful (move beyond the “What” to the “Why”) and give company executives the insight they need to react (“What it means”).
In this case a revenue forecast model could be built by working backwards through the analysis process using a) the Market Forecast (total market size and market share), b) the regional shipping days in the period, and c) the wholesaler trends and patterns for inventory carriage throughout the year to predict sales performance. Each wholesaler could be projected to support their share of the market, and the calculation of what that means relative to their shipping days and their inventory carriage would generate the sales forecast.
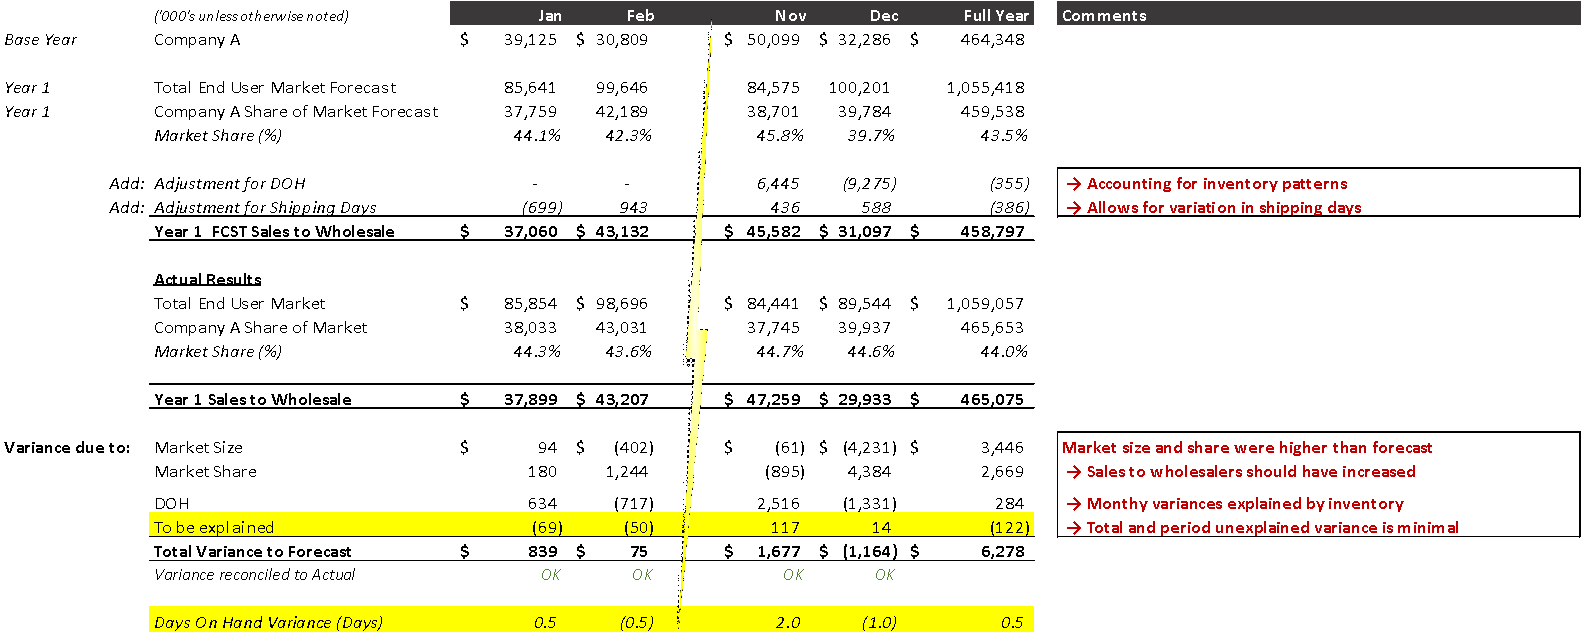
By building the forecast model this way, sales variances related to market behaviour can be understood and addressed properly by sales and marketing teams, and sales variances related to wholesaler behaviours can be addressed by trade relations – or self-corrections can be anticipated. In either case, the impact of the variance on future periods will be different and can be factored into the subsequent forecast appropriately.
Summary
Financial models come in many shapes and sizes. There are common fundamental attributes that make a good model including inputs and assumptions, simplicity, and transparency.
In traditional financial models, while there will be variations, the basic premise of the model, the financial statements and supporting schedules, is widely accepted. In the case of specialty models the design and architecture can vary broadly – the key is to fully understand what is being analysed, and make sure the inputs and assumptions are aligned.
Happy Modeling!
Written by Kim Male, Director at The Marquee Group